Accounting Error is not Cash Flow
moneyA popular form of clickbait financial articles is those explaining how high-earning households are actually living basically "paycheck-to-paycheck". You'll see titles like "Barely making it on $400,000" or "$500,000 doesn't go that far for this family of four". The number seems to keep going up; I expect to soon see stories on how $900,000 isn't enough money to really "get by" in suburban Los Angeles.
This claim is almost always backed up by some variant of what I would consider one of the worst financial charts on the entire internet, courtesy of "Financial Samurai":
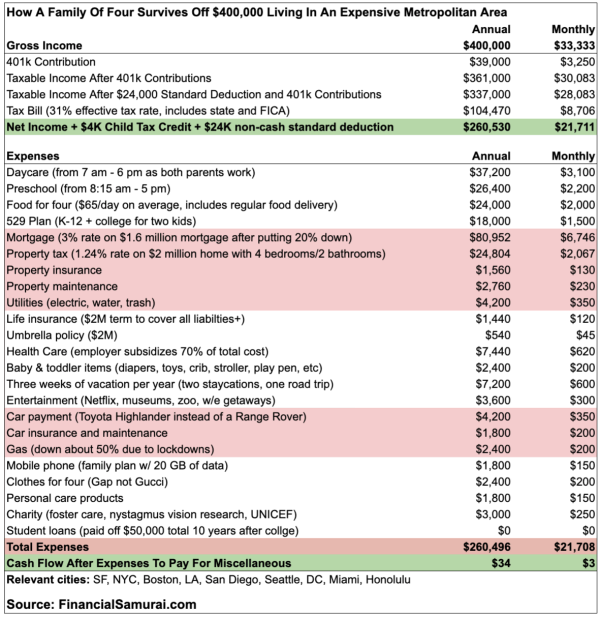
The chart here claims to compute an annual "cash flow" of $34, or $3 per month.
$3. Not even enough to buy a latte. This family is teetering on the brink of financial collapse. They're basically living paycheck-to-paycheck, after all, with only $3 left to their names at the end of the month.
Commentors on the internet often dissect this chart line-by-line, pointing out that the family could spend less on vacations, or move to a smaller home, or eat more cheaply, or attend public schools, or are at a lifetime highpoint of mandatory expenditures due to having two small children. These comments are not wrong, but they're missing the point.
The reality is that this chart is incredibly disingenuous because it confuses expenditures and savings, intentionally, to make it look like this family is much worse off than they actually are. The bottom-line number of $34 in annual "cash flow" is nothing short of a lie.
What this chart is demonstrating is accounting error: The person making the chart failed to make the columns add up to $0 as they should have, and uses that failure to advance a false narrative about the state of this family's finances.
Let's talk about why, and how to fix it. But first, a story.
Tommy's Lemonade Stand #
Your nephew, Tommy, has set up a lemonade stand. It seems to be doing great. At the end of the week, you ask how business is going.
"I'm barely surviving!" he says.
"How so? I saw a long line around the block when I stopped by" you reply.
Tommy, furious, pulls a single dollar bill out of his pocket. He begins his rant:
I talked to my accountant and here's where I stand. I sold 100 cups of lemonade for $1 each, so have $100 in income.
The lemons and sugar cost me $50, and I paid another $10 in taxes.
I put $20 into my piggy bank, spent $10 at the arcade, stuffed $5 under my mattress, and deposited $4 into my savings account.
At the end of the week, I only have $1 of cash flow after expenses to pay for miscellaneous! One miserable buck!

He complains as he waves the dollar around in his hand. "A single dollar more in taxes and I'm in the red!"
His accountant made a chart detailing how dire the scenario is:
| Tommy's P&L | Gains/Loss |
|---|---|
| Sales | $100 |
| Total Income | $100 |
| Lemons | (25) |
| Sugar | (25) |
| Taxes | (10) |
| Net Income | $40 |
| Piggy Bank | (20) |
| Arcade | (10) |
| Mattress | (5) |
| Savings Account | (4) |
| Total Expenses | (39) |
| Remaining Cash Flow | $1 |
"Hold on, Tommy." you say, and recount his finances.
"Your revenue was $100 on a cost of $50, for a profit of $50. You payed $10 in taxes, leading to $40 in net profit.
You spent $10 of that at the arcade, and saved the other $30: $20 in your piggy bank, $5 under your mattress, $4 in your savings account, and the $1 which you're holding right now.
All your money is accounted for and you're doing very well. Great job!"
Tommy seems confused. "Why did my accountant say I had one dollar leftover, then? I feel like I'm barely scraping by here."
"Your accountant didn't see that dollar bill in your pocket, so he couldn't make the numbers add up to $0 like they should have. He was talking about accounting error. That's what it means to have money left over at the end of the accounting process."
Tommy seems even angrier. "The numbers have to add up to $0? I'm always going to be broke? That's not fair! I should have way more than $1 of cash flow here based on how much lemonade I'm selling."
You draw a new chart that shows how to properly account for all the money coming and going through Tommy's operation:
| Inflow | Outflow | |
|---|---|---|
| Income | ||
| Sales | $100 | |
| Expenses | ||
| Lemons | $25 | |
| Sugar | $25 | |
| Taxes | $10 | |
| Spending | ||
| Arcade | $10 | |
| Saving | ||
| Piggy Bank | $20 | |
| Mattress | $5 | |
| Savings Account | $4 | |
| Pocket Dollar | $1 | |
| Total | $100 | $100 |
"Your cash flow is $40, because that's how much money you had after subtracting your expenses from your income. The $1 was the accounting error, not the cash flow. You need to find an accountant who knows what they're talking about. And if your taxes go up by $5, you can choose to spend less at the arcade, or you can save less. It's up to you, but your business will still be turning a tidy profit. I wouldn't worry about it."
"Wow", says Tommy, "I guess that's what I get for hiring a cut-rate accountant. Thanks for clearing it up for me. It's sure good to know my business is doing 40 times better than I thought!"
It All Adds Up #
Without going deep on accounting to discuss things like depreciation, appreciation, capital gains, etc., for a family earning, spending, and saving wages, we can recognize that there is a fundamental equation in play:
income - expenses = savings
Every dollar you earn is either spent (which includes mandatory expenditures like taxes) or saved.
What Tommy (and the Financial Samurai) attempted to do was rewrite the equation:
income - expenses - savings = "cash flow"
However, the correct formula here, as any Algebra 1 student could rearrange, is:
income - expenses - savings = $0
If you don't get $0 when computing income minus expenses and savings, you have accounting error: Somewhere, you didn't find a source of savings or source of expenditures to make the numbers balance out. Indeed, we have to fix the equation to account for this possibility:
income - expenses - savings = accounting error
What we see in "Surviving off $400,000" is a monthly accounting error of $3. $3 of accounting error on a gross monthly income of $33,333 is actually great in terms of accuracy; it means whoever prepared this chart painstakingly accounting for the family's savings and expenses, but missed by 0.01%. Perhaps they mistyped the mortgage as $6,746 when it was actually $6,749, for example. Or maybe they engineered the chart to show a tiny accounting error, misleadingly labelled it "Cash Flow", and used this numerical sleight of hand to push a preconceived ideological narrative. We'll never know.
Financial Samurai's Family #
Let's fix Financial Samurai's chart.
There are three primary sources of error that confuse savings with expenditures: The 401(k), 529 plan, and the principal component of the mortgage. Like many Americans, the last of these accounts for a large majority of their annual increase in net worth.
For the 401(k), this is unambiguously savings, albeit pre-tax dollars that will be worth less upon their eventual withdrawal due to paying taxes at that time. For a fair accounting, I adjusted this to assume a 24% average tax rate paid upon withdrawal, booking the future tax expenditure now so that the savings numbers are in uniformly post-tax dollars.
The 529 plan is, of course, also just savings. The full $18,000 is accounted for as savings.
To account for the principal reduction in the mortgage, which is also a form of savings, I used an average rate of 65% principal, 35% interest, which is representative of what will happen over the entire lifetime of a 30-year loan. This results in booking $52,619 of savings.
There's also the matter of the car payment. This is definitely a form of savings, since they're paying off a loan. At the end of the loan, they'll still have the car, but the loan payment will stop. The car still has value, increasing their net worth. However, the car is also depreciating, so I'll err on the side of caution here and assume that the car is depreciating at the unrealistic rate of being worth $0 at the end of the loan.
I also had to normalize the income portion of the chart to account for some hand-wavey math around tax credits that isn't really explained. The fixed version looks like this:
| Spent/(Earned) | Saved | |
|---|---|---|
| Income | ($400,000) | |
| 401k | $9,360 | $29,640 |
| Taxes | $96,870 | |
| Daycare | $37,200 | |
| Preschool | $26,400 | |
| Food | $24,000 | |
| 529 Plan | $18,000 | |
| Mortgage | $28,333 | $52,619 |
| Property tax | $24,804 | |
| Property insurance | $1,560 | |
| Property maintenance | $2,760 | |
| Utilities | $4,200 | |
| Life insurance | $1,440 | |
| Umbrella policy | $540 | |
| Health Care | $7,440 | |
| Baby & toddler items | $2,400 | |
| Three weeks of vacation | $7,200 | |
| Entertainment | $3,600 | |
| Car payment | $4,200 | |
| Car depreciation | $4,200 | |
| Car ins./maintenance | $1,800 | |
| Gas | $2,400 | |
| Mobile phone | $1,800 | |
| Clothes for four | $2,400 | |
| Personal care products | $1,800 | |
| Charity | $3,000 | |
| Cash in your pocket | $34 | |
| Total | $(104,493) | $104,493 |
| Accounting Error | $0 | $0 |
As we can see, the family is saving $104,493 per year.
Adding the "cash in your pocket" line item, in honor of Tommy, we get an annual savings of $104,493, and an accounting error of $0.
It's a Hoax. #
So what's going on here?
Financial Samurai's hypothetical family is increasing their net worth by approximately $104,000/year. At time of writing, the median annual income of a full-time worker in the United States was exactly half that: $52,000/year. In other words, this family is saving money at the same rate two median workers would if they had zero expenses (no taxes, no rent, no food, no anything). In 18 months, this family accumulates more money than the median American household's entire net worth.
There are obviously legitimate debates to be had about what the magical word "rich" means in this country, and whether Financial Samurai's hypothetical family could cut back a bit, but two things are beyond debate.
First: this family is saving money at a rate that is impossible for the median household, while simultaneously living an objectively affluent lifestyle. The median American household spends a third as much on food, half as much on entertainment, a third as much on personal care, and a bit more than half as much on clothing.
Second: the $34 number at the bottom of the chart is pure fiction. It does not correspond to any actual fact about this family's finances. You could construct this chart to make it larger, smaller, even negative if you wanted, because it's just an error.
As much as we might laugh at Tommy's mistake of his missing dollar compared to the $40 of profit his business actually turned, the Financial Samurai distortion is worse: it understates this family's annual savings by a factor of 3,000. It does not belong here in any form, and its inclusion as "cash flow" is a hoax.
Sadly, many major news outlets, including those who should have the financial savvy to recognize this total bamboozle of a chart, have run with this or a similar version of it when talking about the finances of higher-earning households. We can and should do better.
Objections #
Saving for Future Expenses is an Expense #
You might point to the line item for 529 and say, since this money will eventually be spent on college tuition, it isn't really savings at all, but rather an expenditure that we're booking now instead of later. The same for 401(k) contributions -- these dollars will likely be spent in retirement, thus are future expenditures.
Much like the original chart misappropriates what "cash flow" is, this objection misappropriates what "savings" means. The final fate of every saved dollar is either to be spent on something, or passed on to your heirs when you die, who will then have to either spend that dollar or pass it on to their heirs, and so on. Every dollar is eventually spent.
Under the "every dollar saved is eventually spent, thus is not saved" definition, no money is ever saved. Instead of savings, we have to talk about money eventually spent by you or your heirs (MESBYOYH for short)
We would have to rewrite the equation as
income - expenses - MESBYOYH = $0
It doesn't seem meaningful to redefine "savings" as a thing that, by definition, can never actually happen, so let's just not do that. The family is saving money which they intend to expend later or pass to their heirs, which is what all saving is for.
Saving for College is Different #
Maybe there's some sense in which saving for college is different, because it does feel like a sort of mandatory future expenditure.
Under this family's given budget, doing so would be unambiguously double-dipping: They're currently spending $63,000/year on daycare and private school, which is enough to cover in-state tuition at a reputable school for two students (in-state expenses at time of writing for University of Washington is $34,000 per off-campus student).
To put it another way, let's say you spent $20 eating out today, and $20 at the grocery store buying food for tomorrow. Even though the amount of money you spent on food today was $40, it's not accurate to say your daily food budget is $40. It's $20 today, and $20 tomorrow.
We could certainly categorize the family's savings into earmarked savings and non-earmarked savings. Under this metric, the house payment becomes $52,000 of eventually-inherited wealth, and the remainder is earmarked savings that will be spent down in retirement. With 20 years of such savings, they'll be passing down an estate worth over a million dollars to their heirs. The median inheritance in the United States is $69,000, or less than a year and a half of non-earmarked savings for our "cash-strapped" family. Not too shabby.